An infographic is a great way to go viral, earn links and social media shares as well as to give your content wings by re-packaging it.
When done well, infographics work like magic for driving traffic and exposure.
From presentation data, to visual resumes and just fun items to share through social networks, you can make intricate infographics in minutes. These five tools are an excellent way to do so.
Tools for Data Visualization
One of the most frequent questions I get is “How can I start creating infographics? Where to start?”. Well, this article is exactly about “Where to start”, as as well as how to get inspired and how to start experimenting with visual-based data.
If you are worried that creating an infographic will be too hard, you should be pleasantly surprised by these tools. All of them pretty much do the work for you, and yet the end result is professional looking.
Visual.ly
Utilized frequently by high school students who want visuals for projects as well as by website owners who are looking for dynamic blog charts, this is a great infographic creator. You can make complex and attractive graphs, charts and visual graphics, then share them with others. You can also get ideas by looking through their large database of user created content.
Their specialty is Twitter data charts that are made using pre-created layouts that use your information gathered through signing into your Twitter account and organized for you. But they have many other options.
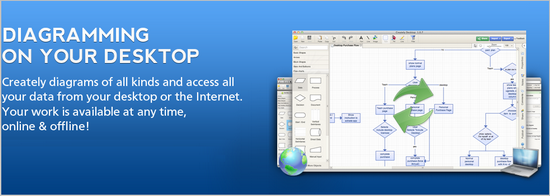
 Creately
If you want a more basic – but still attractive – style of graph without registering for a site, Creately is probably more your style. They have mind maps, flowcharts, pie graphs, bar graphs and more. They also have a team collaboration feature, which makes it great for joint projects or business use. A number of major brands use them, such as Good Year and Lenovo.
Free Tools for Personal Branding Infographics
Vizify
Twitter is one of the most popular websites on the net. If you want to show your stats, especially for your blog’s Twitter account or something similar, you can break it all down into a simple but interesting infographic through Vizify. It is completely free and, as they say, it only takes 10 seconds to make.
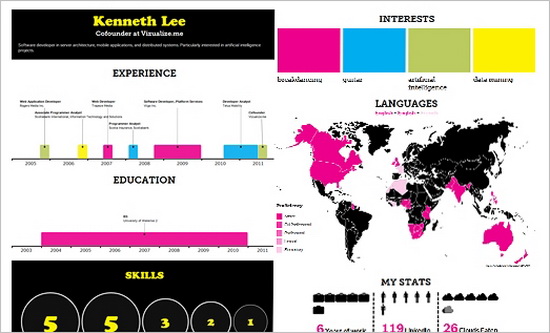
Visualize.me
Still in beta version, this is a really fun tool that allows you to create a visual resume by signing into your LinkedIn profile. All relevant data there will be worked into a graphic format, which you can then customize to your specifications. They have several layouts you can use, and you will be sure to stick out to your potential employers.
Re.Vu
This is a little more complex than the one above, but the idea is the same. You sign into your LinkedIn profile and it creates a visual version of your resume. You can also create an infographic showing analytics for your website.
Detailed Tutorials and Useful Templates
Lastly, not everything is done with tools. Luckily we have a few very detailed tutorials on how to build infographics:
- 5 Unbeatable Types of Infographic + Free Tools to Create Them: This one lists some useful templates to build upon, for example, a blank periodic table to fill in and Free Vector World Maps Collection.
- Design a magazine infographic (using Adobe Illustrator CS3 or later): A step-by-step guide into creating a very nice-looking infographic. And here’s another one for Adobe Illustrator
- Here’s the awesome collection of visual hooks and elements for your future infographics: learn to create beautiful columns, trendy lines, beautiful charts, etc
- Here’s an awesome video tutorial on Visualizing relationships between various objects and elements.
- Here are plenty of awesome Photoshop templates and icons to use in your infographics (or to just get inspired)
Conclusion
The most important thing about creating a viral infographic: idea comes first, then a design. So before you start looking for web design services to help you with your infographics, make sure you have an idea, try implementing it using the above tools and tutorials. Experiment and experiment again!


2 Responses
Hi there, you may also be interested to look into Piktochart.com, it’s a drag and drop infographic editor 🙂
http://piktochart.com/2012/08/case-study-115-comments-240-inbound-links/
You should add http://www.infogr.am to the list. A cool service for making interactive infographics. I use it every day
Comments are closed.