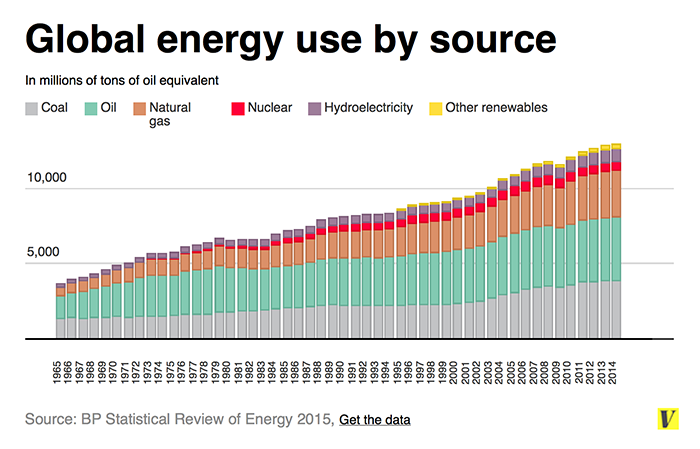
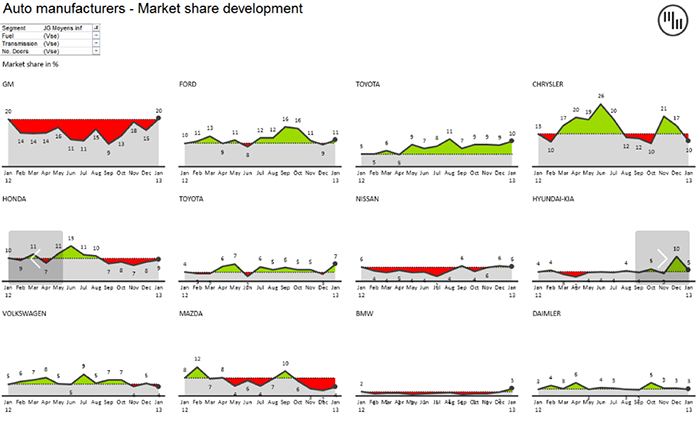
Visualization is key to properly conveying numbers and percentages online. Human beings are visual creatures. We do better seeing representations than we do hearing or reading stats.
Therefore visualization is the marketing goldmine: Graphs and charts are much more sharable than many other types of images. More importantly, graphs seem to trigger more clicks because people are curious to see the details.
Charts and graphs make great visual tweets, infographic sections, presentation slides and social media updates.
***Once you are done going through the below tools, don’t miss this one: 5 Easy-to-Create Infographics Types That Work for Any Niche
These ten are some of the best available, and you should definitely give them a try.
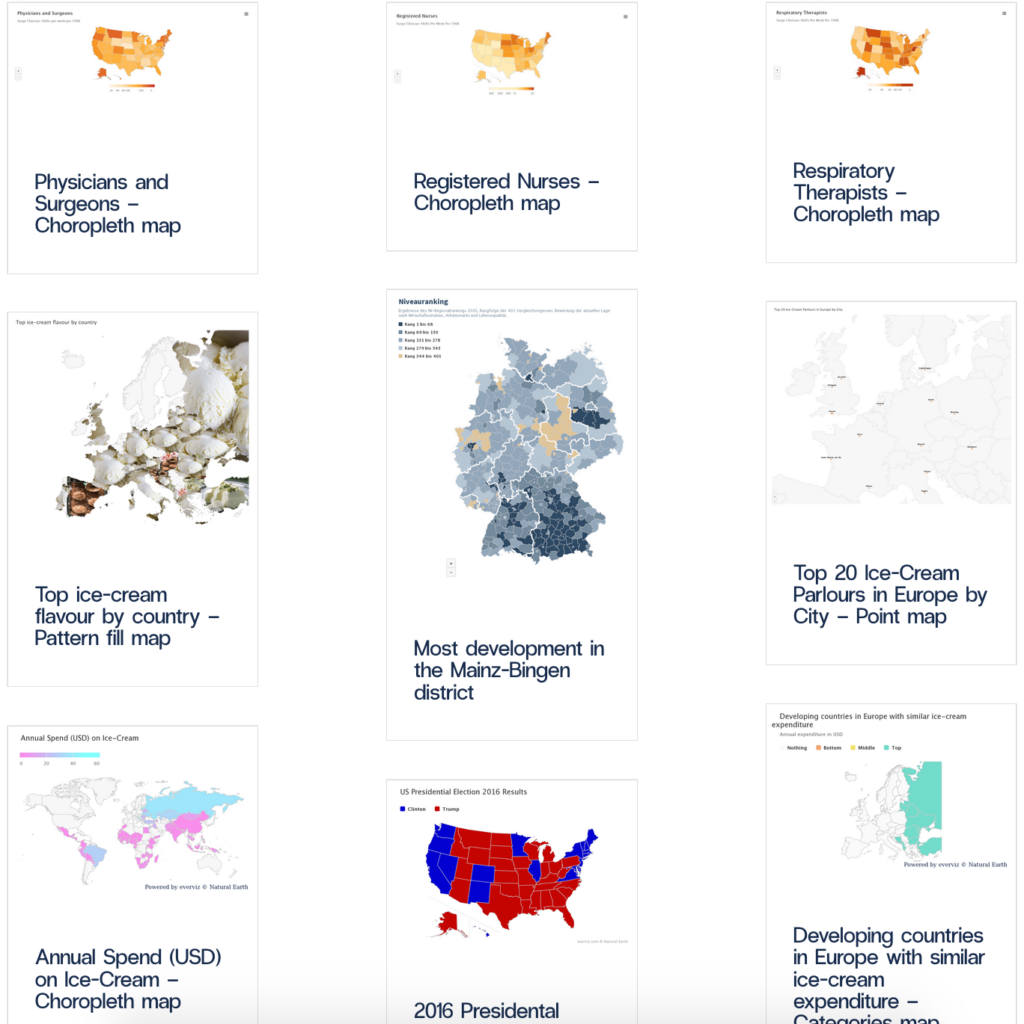
Everviz
A newer platform on this list, Everviz offers a variety of visualization options, from timemaps and pie charts to maps and bubble charts. The visualizations are responsive, can be downloaded in several formats and are interactive too!
These visualizations are easy to build and they look professional. Great tool!
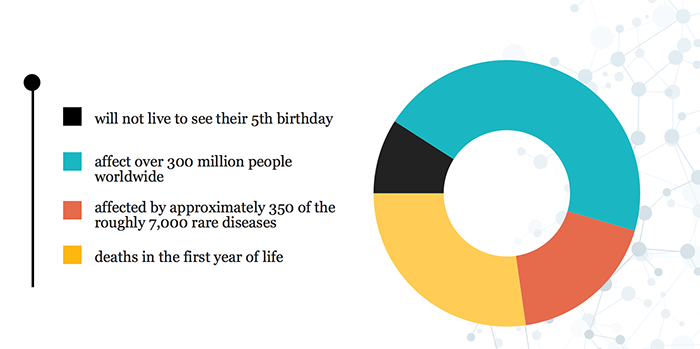
Piktochart
There is a reason Piktochart is on the top of most data visualization tool lists. Intuitive and thorough, you can make genuinely amazing charts, infographics and data presentations using their features.
They have accounts for both educators and non-profits, but most will be perfectly satisfied with their general pro account, which runs between $15 and $29 per month. Their free account has plenty of useful features if you don’t want to pony up the cash, though comes with limited templates.
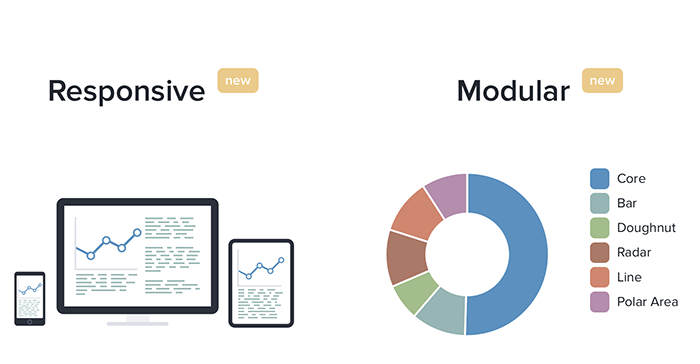
ChartsJS
Just want some very basic charts that show off data without any frills? For business meetings, ChartsJS is a great option. It is a bare bones, open source visual generator that gives you six different templates to choose from.
They are fully animated, customizable, and interactive. So you can make the end product as advanced as you like, and show various layers of data within the same chart.
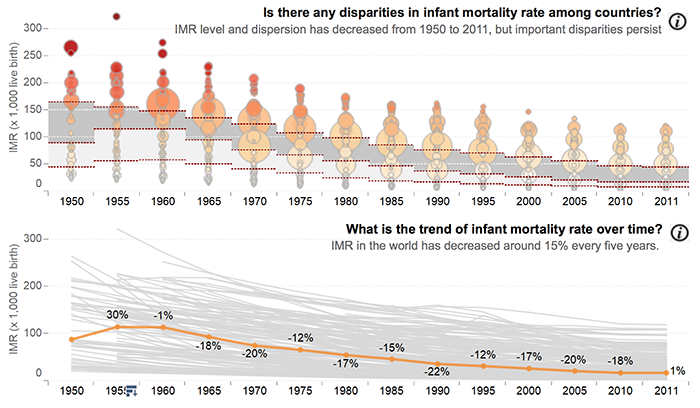
Tableau
At first glance, Tableau looks like a bit of a Pikochart rip off for graphs instead of Infographics. But delving deeper, it is much more. You put in the data, customize, and in minutes you can have full color, breathtaking charts that take a very clean and direct approach to sharing figures.
Their gallery shows you the many ways the tool has been used, and some of the results are extremely creative, without the data getting lost in translation.
FusionCharts
One big complaint about many visualization tools is that they are one sided towards computer screens. Responsive design isn’t just for web design anymore. Presentations need to be more flexible, as well.
FusionCharts has one of the biggest chart databases online, and all aimed at being intuitive for mobile or web viewing. They also have more than 1000 maps. Unfortunately the licensing can be a tad bit steep. But if it is qualifying as a business expense (and so can be written off), it is probably worth it.
Google Charts
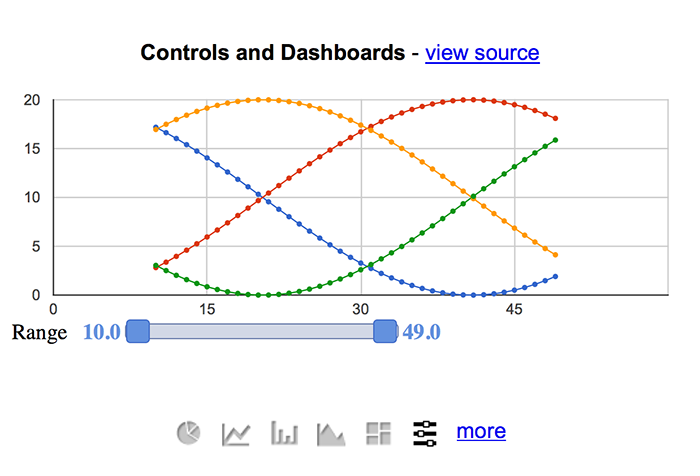
Google seems to have a hand in everything these days. But this one is a surprise to many. Google Charts program has a number of commonly used chart templates including pie, graphs, and line. You can quickly and easily transport data and make attractive – if basic – charts for free.
They are cross compatible with Android or Apple mobile operating systems thanks to their use of HTML5/SVG, and can be exported. Of course, you can also quickly share it with people with a quick invite, like any other Google product.
Timeline
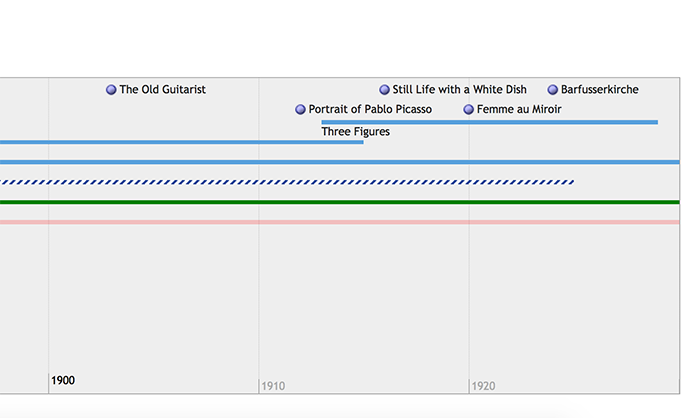
Temporal data is some of the hardest to visually express. The best way is almost always considered to be through Timelines, but those can be very complicated and time consuming to make. Timeline widget makes it much easier.
You simple add in the dates and small snippets that compress the data into this interactive format.
The design is a tad bit sloppy, but it is open source and free, and it does the job. Plus it creates bullet introductions that can be clicked on for an expanded description in a popup box.
That is extremely handy if you need a bit more information on each point, without overwhelming the timeline.
Dipity
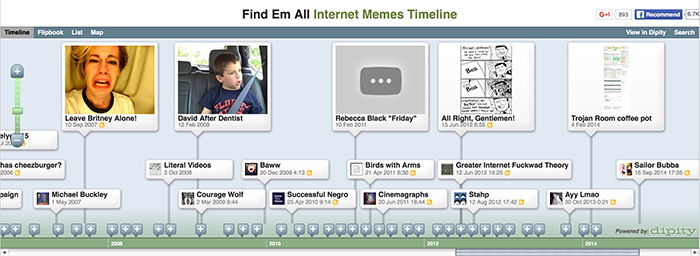
If you want a more visually appealing and clean looking timeline, and you don’t mind paying for it, you may prefer Dipity. It creates an embeddable timeline with images and a simple bottom scrolling calendar for keeping track of events.
Those images can be clicked on for more information, or to take your viewer to outside links as third party sources. Pro accounts start at $4.95 per month, though you have to get a $99 monthly account if you want to use their timelines with a commercial license.
Datawrapper
You know when you look at a news article on a major website and see a live chart featuring something like the current ticker of a collection of stocks?
Chances are that chart was created using this tool. Datawrapper is one of the fastest and easiest ways to create interactive visual data.
Zebra BI
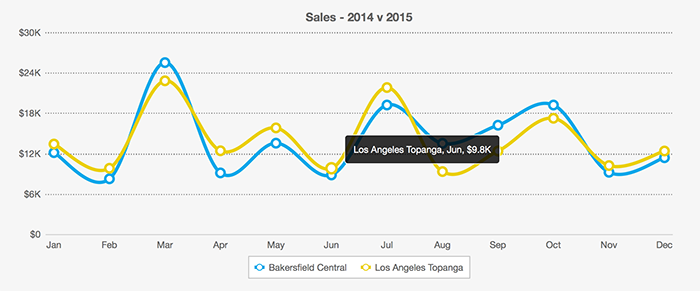
Just need some basic data charts from Excel rendered? All it takes is two clicks with Zebra BI. This is a super basic app, and it doesn’t have a whole lot of applications. But for basic use, it is a peach. It costs $238.80 per year, or $20 per month, with a free trial so you can check it out.
Do you have any tools you think should go on this list? Share your tools for visualizing numbers and percentages below!



4 Responses
Cool post as always, Ann. I personally use Canva and Piktochart. Though Piktochart is easy to use, I love the collection of images that Canva gives me.
I like Piktochart becuz it looks nicer
Hey Ann Smarty,
I know that visualization is key to properly conveying numbers and percentage online.
Human beings are visual creatures. We do better seeing representations than we can do hearing or reading stats.
People always curious to see the details so we have to create graphs seem to trigger more clicks .You have suggested good tools easy way which is very easy to understand and to choose which is good for us but i use canva which is very easy to use.
thank you,
-sweety
Hey Ann,
Your post is very helpful and informative for all readers and for me also.
You have suggestied good tips about Internet Marketing Ninjas Blog.
Thank you
Sweety
Comments are closed.